As per Microsoft, Chart web part in SharePoint 2013 has been discontinued, So, chart web part will be missing! Of course there are many 3rd party products available to bring Chart functionality in SharePoint 2013, is it possible to resurrect the same old chart Web part in SharePoint 2013? Yes! We can!! Here is how to enable chart web part in SharePoint 2013:
Step 2: Upload the web part to Web parts gallery:
Next step is to enable chart web part in SharePoint 2013.
![how to enable chart web part in sharepoint 2013]()
Step 3: Add chart web part to SharePoint 2013 page:
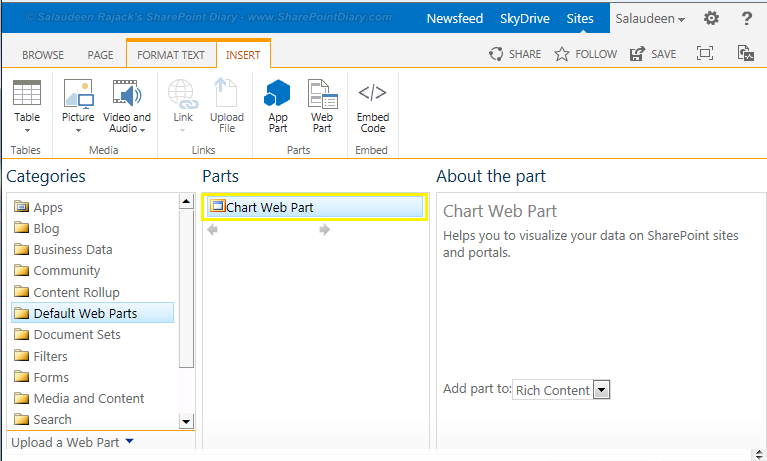
So, now we have the web part ready! Navigate to any page where you want to add chart web part, Click on "Web Part" from "Insert" tab, Choose "Chart Web Part" and click "OK".
![chart web part in sharepoint 2013]()
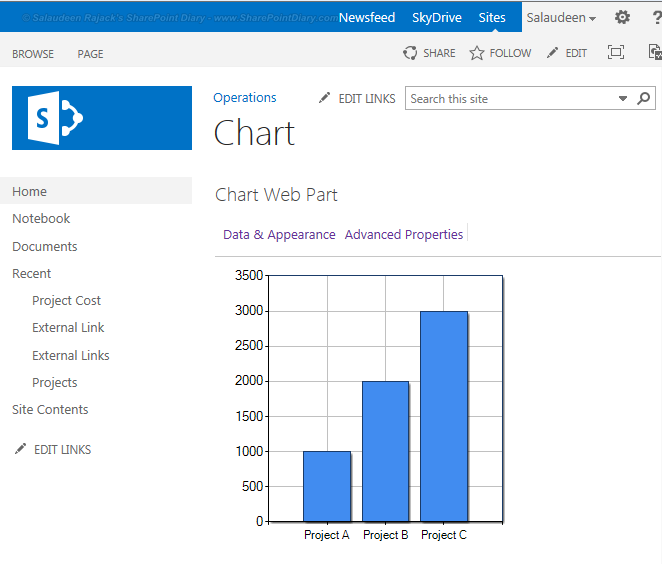
Configure Data connections and other properties of the chart, and here is the output:
![how to create chart web part in sharepoint 2013]()
This chart web part also works in SharePoint online 2013!![]()
Disclaimer:I'm not sure this is a supported method, but it serves the purpose!
Step 1: Save this below chunk as a "Chart.Webpart" file<webParts>BTW, I exported this from SharePoint 2010!
<webPart xmlns="http://schemas.microsoft.com/WebPart/v3">
<metaData>
<type name="Microsoft.Office.Server.WebControls.ChartWebPart, Microsoft.Office.Server.Chart, Version=14.0.0.0, Culture=neutral, PublicKeyToken=71e9bce111e9429c" />
<importErrorMessage>Cannot import Chart Web Part.</importErrorMessage>
</metaData>
<data>
<properties>
<property name="RealTimeInterval" type="int">0</property>
<property name="Height" type="unit" />
<property name="IsCustomized" type="bool">False</property>
<property name="ListUrl" type="string" null="true" />
<property name="AllowConnect" type="bool">True</property>
<property name="CatalogIconImageUrl" type="string" />
<property name="Title" type="string">Chart Web Part</property>
<property name="Hidden" type="bool">False</property>
<property name="ShowDebugInfoRuntime" type="bool">False</property>
<property name="BindToDataDesignMode" type="bool">True</property>
<property name="TitleIconImageUrl" type="string" />
<property name="ChromeState" type="chromestate">Normal</property>
<property name="Description" type="string">Helps you to visualize your data on SharePoint sites and portals.</property>
<property name="ChartXml" type="string"><?xml version="1.0" encoding="utf-16"?>
<Chart BorderColor="26, 59, 105" BorderWidth="1" BorderlineDashStyle="Solid">
<Series>
<Series Name="Default" ShadowOffset="2" ChartArea="Default" BorderColor="26, 59, 105">
</Series>
</Series>
<ChartAreas>
<ChartArea BackColor="White" ShadowOffset="2" BorderColor="26, 59, 105" BorderDashStyle="Solid" Name="Default">
<AxisY>
<MajorGrid LineColor="Silver" />
<MinorGrid LineColor="Silver" />
</AxisY>
<AxisX>
<MajorGrid LineColor="Silver" />
<MinorGrid LineColor="Silver" />
</AxisX>
<AxisX2>
<MajorGrid LineColor="Silver" />
<MinorGrid LineColor="Silver" />
</AxisX2>
<AxisY2>
<MajorGrid LineColor="Silver" />
<MinorGrid LineColor="Silver" />
</AxisY2>
</ChartArea>
</ChartAreas>
<BorderSkin BackColor="CornflowerBlue" BackSecondaryColor="CornflowerBlue" />
</Chart></property>
<property name="WorkBookUrl" type="string" null="true" />
<property name="AllowMinimize" type="bool">True</property>
<property name="ChromeType" type="chrometype">Default</property>
<property name="AlignDataPointsByAxisLabel" type="bool">False</property>
<property name="AllowZoneChange" type="bool">True</property>
<property name="DataBindingsString" type="string"><?xml version="1.0" encoding="utf-16"?>
<ArrayOfDataBinding xmlns:xsi="http://www.w3.org/2001/XMLSchema-instance" xmlns:xsd="http://www.w3.org/2001/XMLSchema" /></property>
<property name="ShowToolbar" type="bool">True</property>
<property name="Width" type="unit" />
<property name="HelpMode" type="helpmode">Navigate</property>
<property name="TitleUrl" type="string" />
<property name="DesignerTemplateId" type="string" />
<property name="HelpUrl" type="string" />
<property name="ExportMode" type="exportmode">All</property>
<property name="ConnectionPointEnabled" type="bool">True</property>
<property name="AllowClose" type="bool">True</property>
<property name="AllowEdit" type="bool">True</property>
<property name="Direction" type="direction">NotSet</property>
<property name="AllowHide" type="bool">True</property>
<property name="DesignerChartTheme" type="Microsoft.Office.Server.Internal.Charting.Utilities.ChartTheme, Microsoft.Office.Server.Chart, Version=14.0.0.0, Culture=neutral, PublicKeyToken=71e9bce111e9429c">BrightPastel</property>
</properties>
</data>
</webPart>
</webParts>
Step 2: Upload the web part to Web parts gallery:
Next step is to enable chart web part in SharePoint 2013.
- Go to Site Settings >> Click on "Web Parts" link under "Web Designer Galleries" section.
- On the "Files" tab, Click on "Upload Document"
- Locate the "Chart.webpart" file and specify web part attributes.

Step 3: Add chart web part to SharePoint 2013 page:
So, now we have the web part ready! Navigate to any page where you want to add chart web part, Click on "Web Part" from "Insert" tab, Choose "Chart Web Part" and click "OK".
Configure Data connections and other properties of the chart, and here is the output:
This chart web part also works in SharePoint online 2013!